|
As posted earlier, the time machine works by converting a batter's stats into a series of rates, transforming these rates with the odds ratio, and recombining to get a new batting line. As posted earlier, these are the rates:
- HBP - I didn't do anything with this as it's an infrequent occurrence. I just assumed a HBP in one era is a HBP in any other.
- BB/PA Does this PA end in a walk?
- SO/AB If not a walk, does the batter strike out?
- HR/(AB-SO) If he makes contact, does the ball leave the yard?
- (H-HR)/(AB-SO-HR) or BABIP - If the ball is put in play, does he end up with a hit?
- (2B+3B)/(H-HR) If he gets a hit, does is it an extra base hit?
- 3B/(2B+3B) If it's an extra base hit, does the batter make it to third?
Here's an example of the odds ratio. Batter strikes out 20% of the time in a league where pitchers strike out 35%. How would he do in a league where pitchers strike out 45% of the time?
New K rate = (.2 * .45 / .35) / ((1-.2)*(1-.45)/(1-.35) + (.2 * .45 / .35)) = .28
for HBP I didn't do anything with this as it's an infrequent occurrence. I just assumed a HBP in one era is a HBP in any other.
Strikeout and walk rates are based on smoothed rates of pitcher hitting. The way I smoothed the rates was to take a weighted average of each year and surrounding years. For example:
1965 = (1963 + 2 * 1964 + 3 * 1965 + 2 * 1966 + 1967)/9
Walks and Strikeouts
Over time, here is how strikeout rates of pitcher-batters have fared:
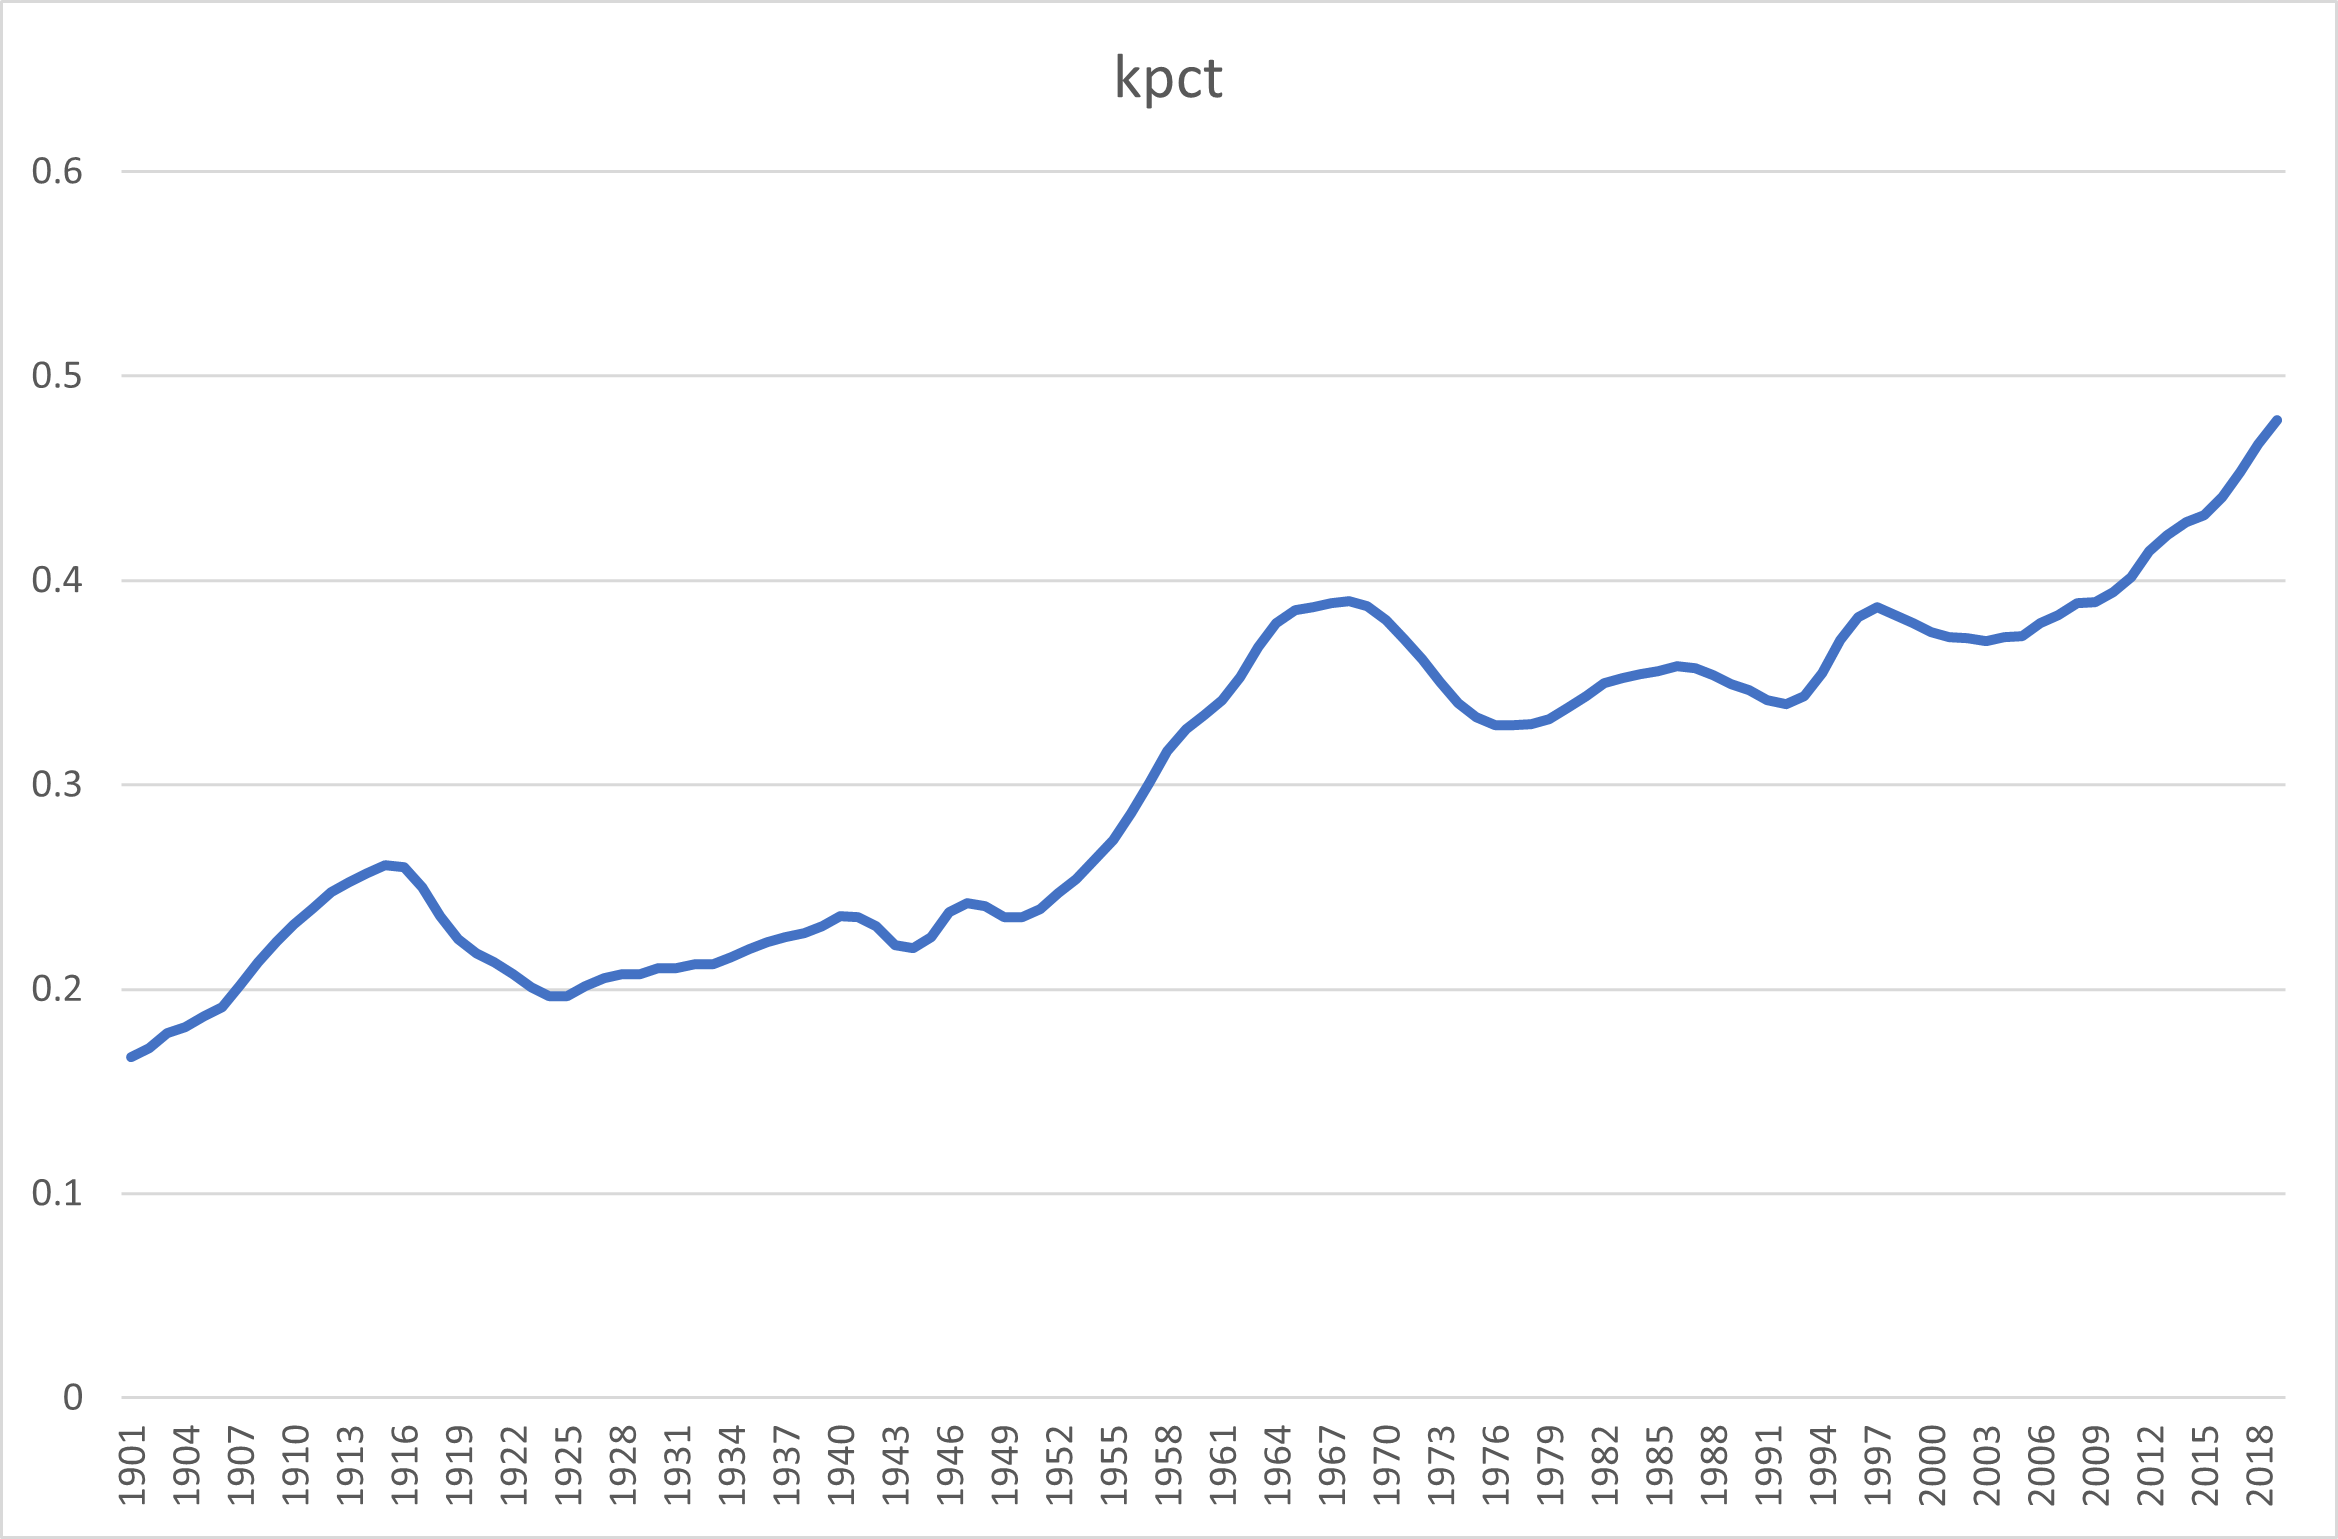
From the deadball era, pitcher-batter strikeout rates actually declined moving into the 1920s. This is likely due to eliminating the spitball and making a greater effort to use clean baseballs, improving visability, especially in the wake of the death of Ray Chapman. Strikeout rates then rose until we ended up with 1968 - the year of the pitcher. Baseball lowered the mound and strikeout rates fell for everyone. Strikeout rates for pitcher-batters reached 39% in 2008, the highest rate since 1968. Strikeouts per 9 innings, however, was 6.8 in 20088, and only 5.9 40 years earlier. I think in this case we can attribute that part of the increase to having more players swing for the seats at the expense of contact, as opposed to pitchers being harder to hit. I am not saying that pitchers did not improve at all between 1968-2008, but perhaps the 1968 pitchers were equally difficult to make contact with because of their high mound advantage.
Strikeouts in today's game are too high. I think most people can agree on that. But who wants their team to have worse pitching? Who wants to be a worse pitcher? Nobody. Maybe baseball should lower, or even eliminate the pitchers mound. Make them throw from flat ground. It might even help to reduce injuries - isn't throwing from flat ground an incremental step in rehab of pitching injuries? Then deaden the ball so we don't see a 90 homer season or a team breaking the 400 homer mark.
In the pitch f/x era, strikeouts have taken off again, with the 2019 rate being 10 percentage points higher than it was only 13 years earlier. To put that in perspective, the last time the pitcher-batter strikeout rate was 10 percentage points lower than 2007 was way back in 1955.
Here are the walk rates:
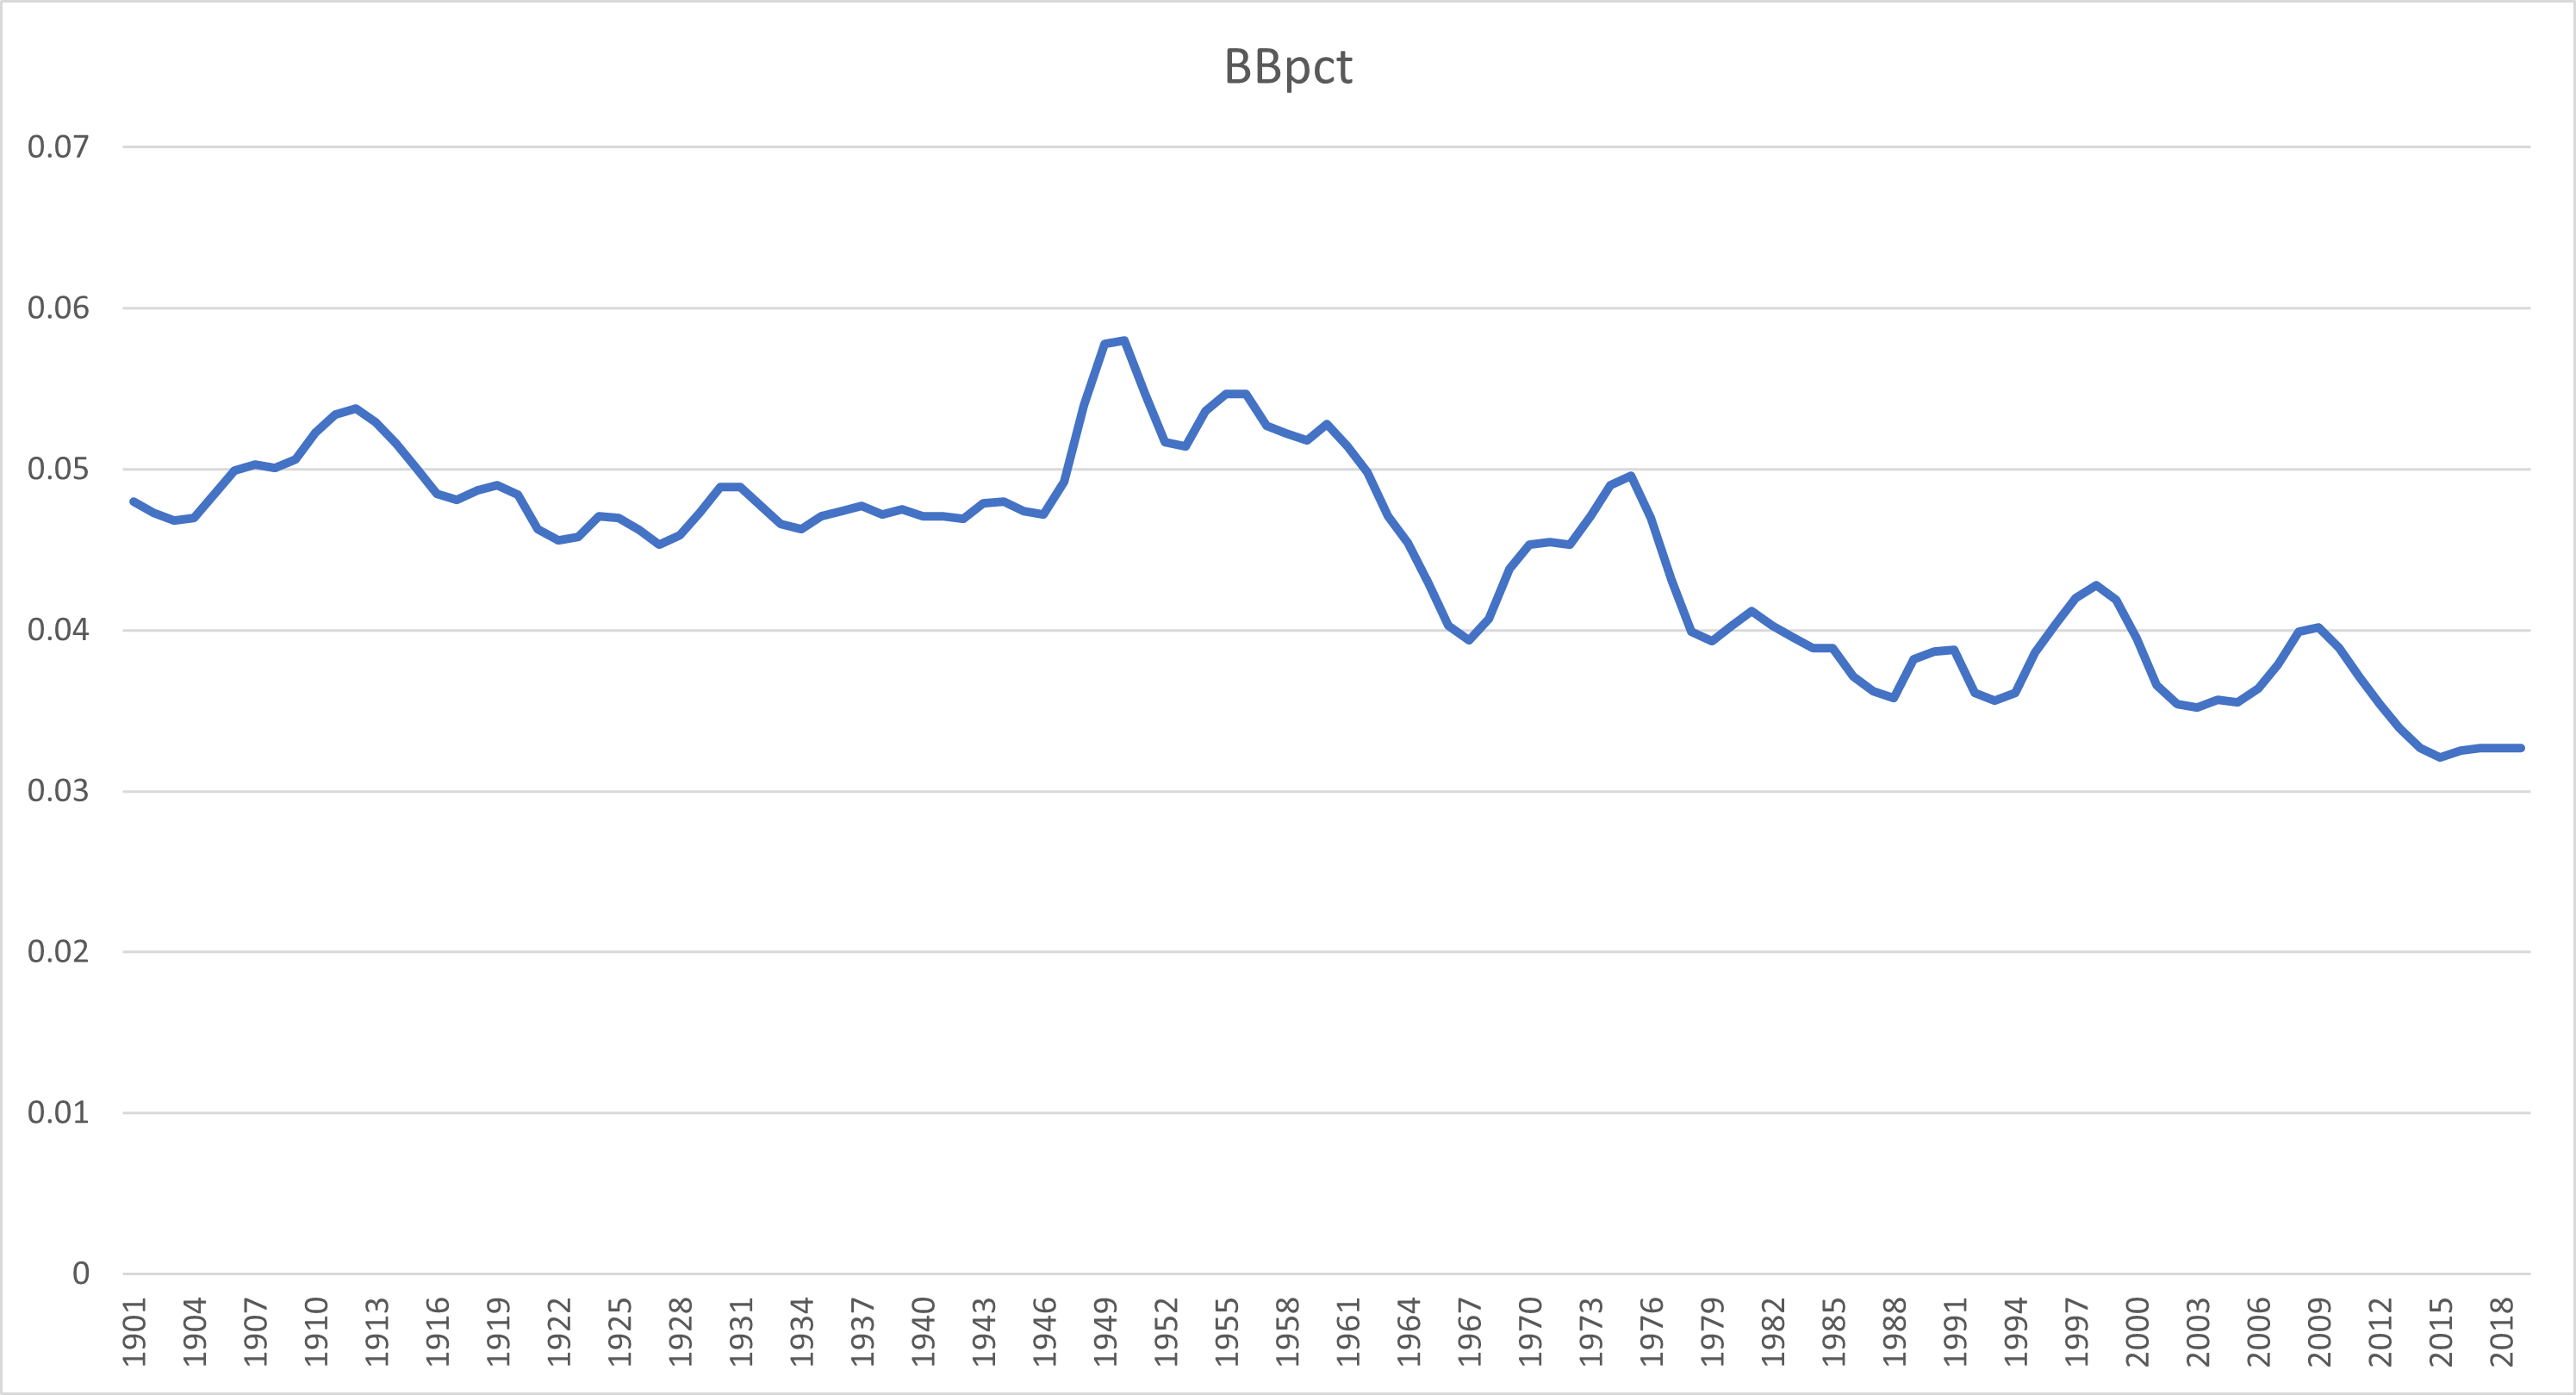
Generally they show a downward trend over time, indicating improved control by pitchers. There is an upward spike in the late 1940s to 1950s. Some of the effects were a whole bunch of people named Eddie on base all the time, and usually not by swinging the bat. Some of the causes might be:
- Teams trying to find the next Bob Feller. Prefer velocity over control.
- The introduction of night baseball. Umpires were under less pressure to hurry the game along to get it over with before dark.
- Interaction - Having night baseball, teams think a wild, hard thrower has a new advantage.
In recent years there has been a virtual extinction of a certain type of player that roamed the earth in my youth - the low power OBP guy. The ideal leadoff hitter, like Brett Butler. Butler had no power, good batting averages, and walked about 90 times a year. His OBP was .377. This type of player would be absolutely ideal in today's game. Right now just about every team has power at every spot in the lineup. That is not efficient at all. If you could replace a guy with a .300 on base percentage and 25 homers with a guy who gets on base at a .380 clip and 5 homers, you would score a lot more runs. What we are getting now is a bunch of solo homers, a Butler type would allow teams a much better shot at multi-run homers.
In the last 5 years that type of player doesn't exist. Bill James mentioned Greg Garcia in a recent mailbag response. Garcia over the last 5 years has a .356 OBP despite isolated power of only .090. Nobody else with that little power comes in over .340. Garcia has never been a regular, did not hit well in 2020 (.279 OBP) and is past 30. It's far from a given that he could maintain a solid OBP if some team did give him every day at bats.
I can think of two players who came up in the last 20 years who initially looked like they could be the Butler-type high OBP, low power guy. The first was David Eckstein. David had very high OBPs in the minor leagues, walking 87 and 89 times in back to back seasons. In the majors though he only walked 46 times per 162 games. Eckstein still had a solid career and was a key contributor to two world series teams. I have no doubt that if he played in 1950 he could have been an Eddie. Playing after 2000 he found that major league pitcher control was too good to allow him to play that game. He had to find other ways to get on base, like swinging the bat (a .290 average in his best years) and taking one for the team (27 HBP for the 2002 Angels).
The next player who looked like he could be a new Butler was even more like the original. He was named Brett, played the outfield, and batted left handed. In the minors Brett Gardner looked exactly like a new Brett Butler. He made a different adjustment to a world where only the power hitters can consistently draw big walk totals: He swung for the seats, and at the age of 35 hit a career high 28 homers.
Homeruns
For timelining the homerun rate, I started with the pitcher-batter homerun rate but had to make some big edits. I don't want the method to show somebody from the distant path hitting 100 homers in today's game just because homers were much more rare back when they played. I don't think the difficulty of hitting a homer (per time making contact) has changed all that much in the last 100 years. The usual league leading figures have not changed very much. The difference is that in 1920 there was just guy -Ruth - trying to hit homers while now we have everybody trying it. Here are the edited rates over time:
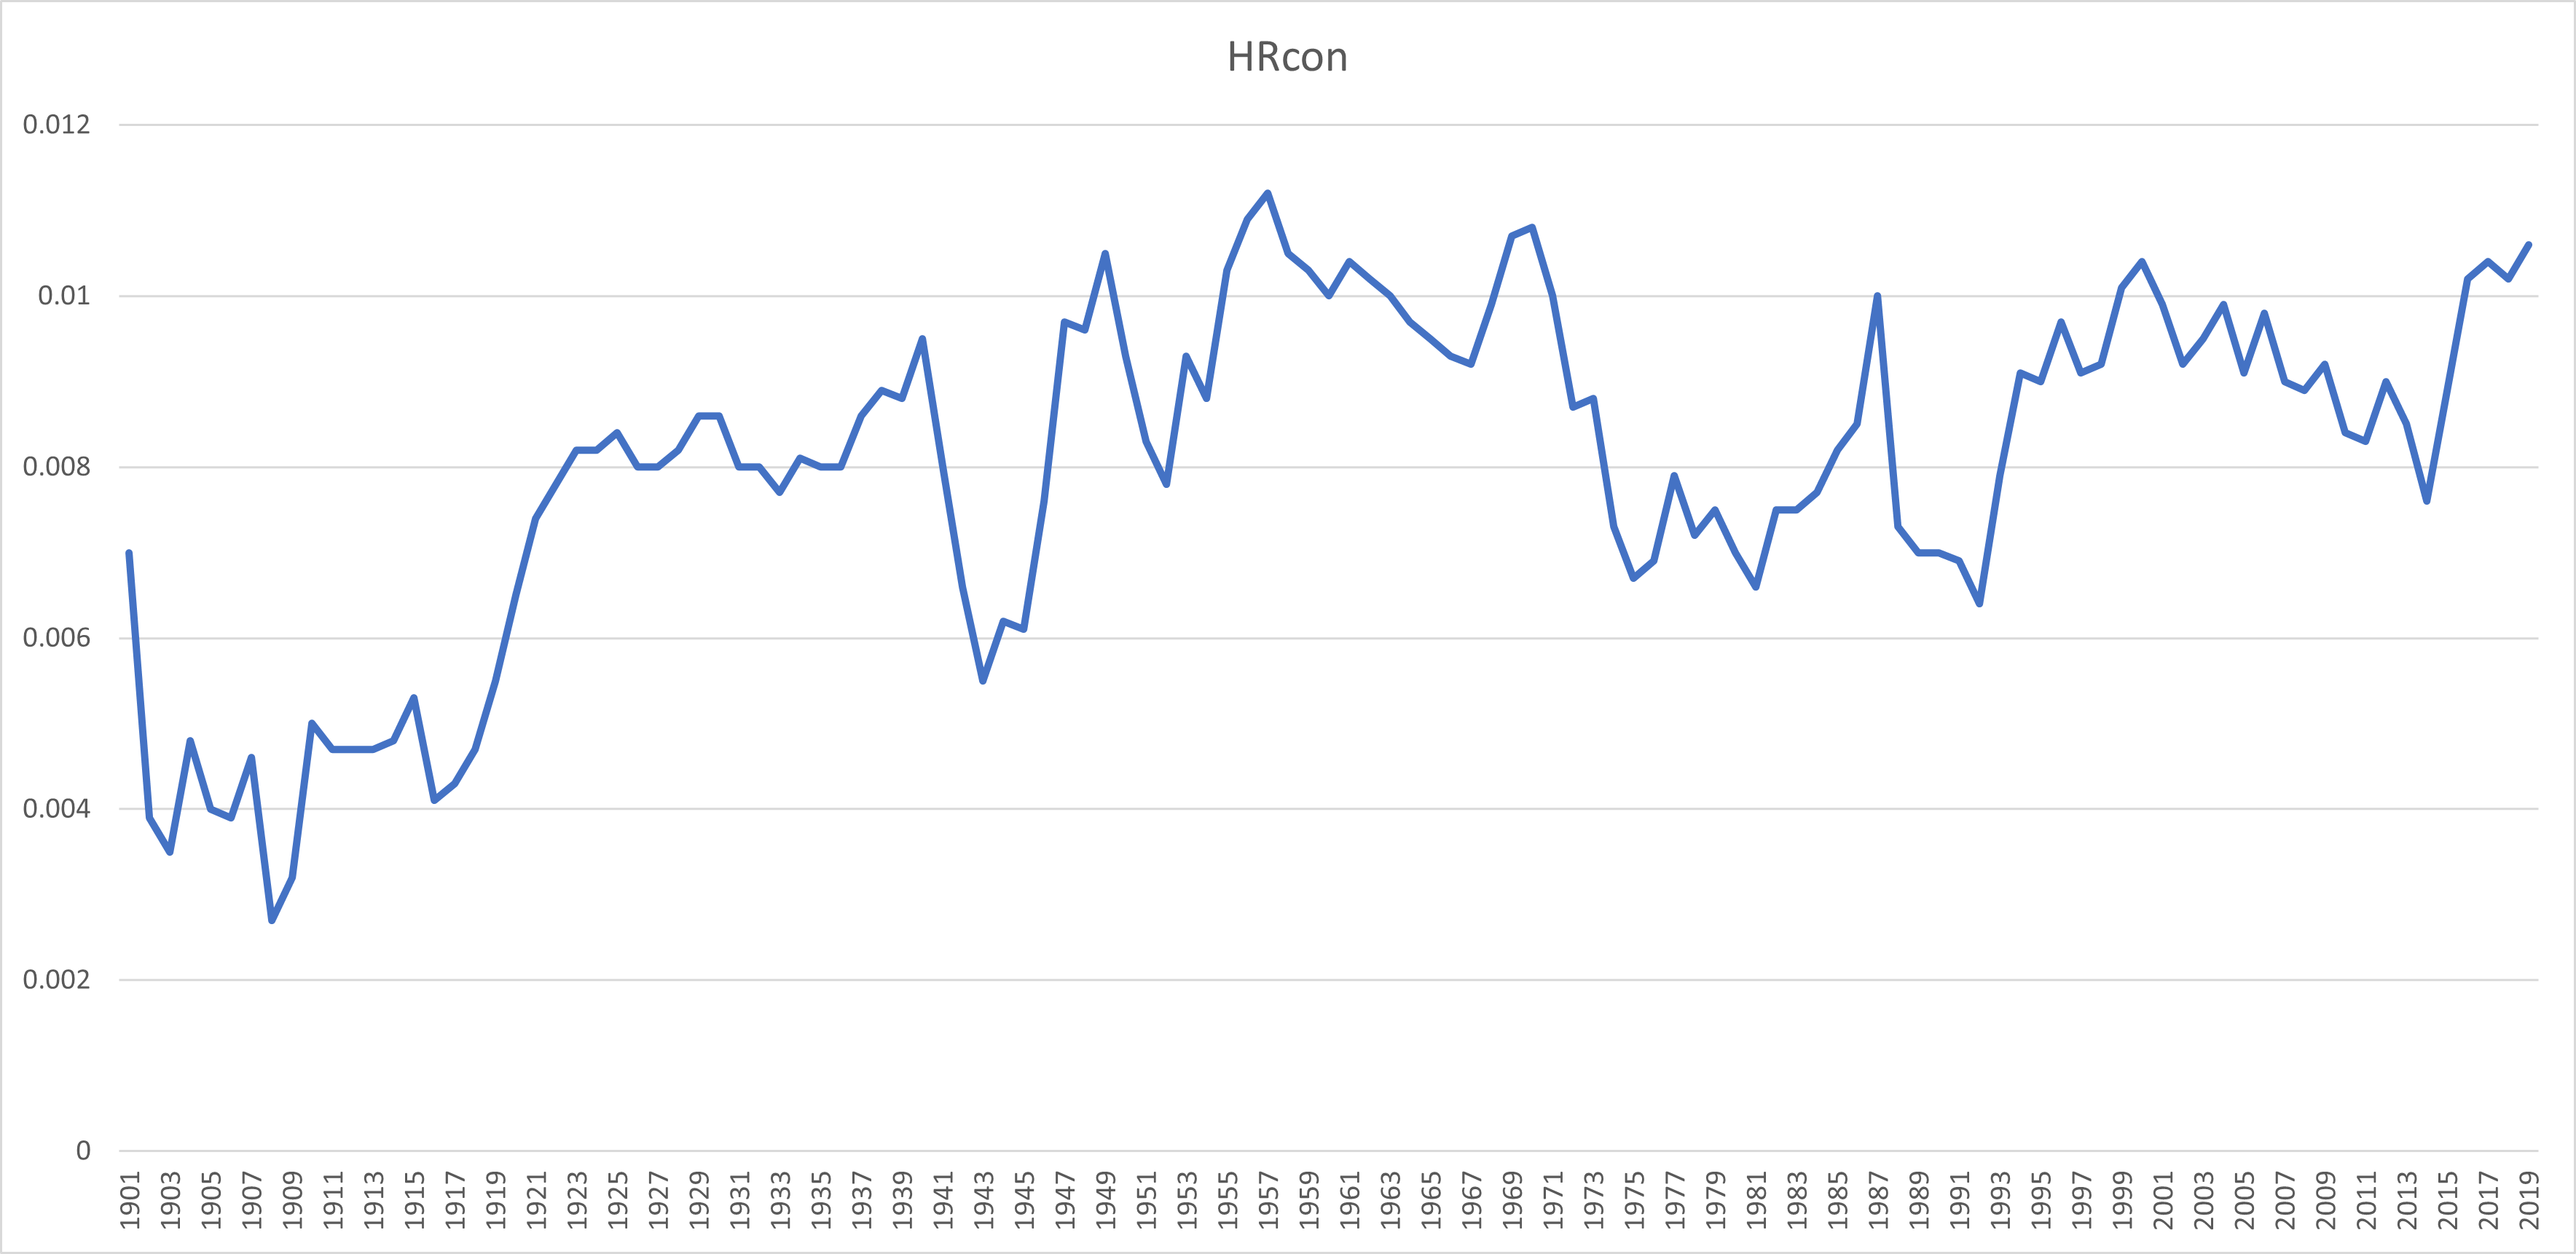
The changes over time can be summed up as:
- Homers were very low in the deadball era, and I don't think even modern hitters going back in time would be able to do much better. The ball was less resilient, and the fences - especially center field - were much deeper.
- Homerun difficulty in the liveball era is about the same as modern baseball.
- During WW2, the ball was less lively. Offense dropped off by about half a run per game during the war years. You could blame that on baseball missing the bats of Ted and Joe, but they were also missing the arm of Bob Feller.
- From the mid 1950s to 1970, pitcher-batter homerun rates were very high, highest in history. They did not get this high again until the ball was juiced in mid season 2015.
- Homeruns were relatively difficult to hit in the 70s and 80s, with the exception of a fluke year in 1987. Some of this is likely due to the Turf parks which were better suited for a speed game.
- Homeruns were easy to come by in what we call the steroid era. It became more difficult in the years after testing was introduced, reaching a nadir in 2014. That year Nelson Cruz was the only player to hit 40, and even 32 was enough to put you in the top 10.
- 2015 was shaping up to be a similar season to 2014 until the second half. Homeruns per at bat increased by 14% after the all-star break, and have remained extremely high ever since.
Batting average on balls in play
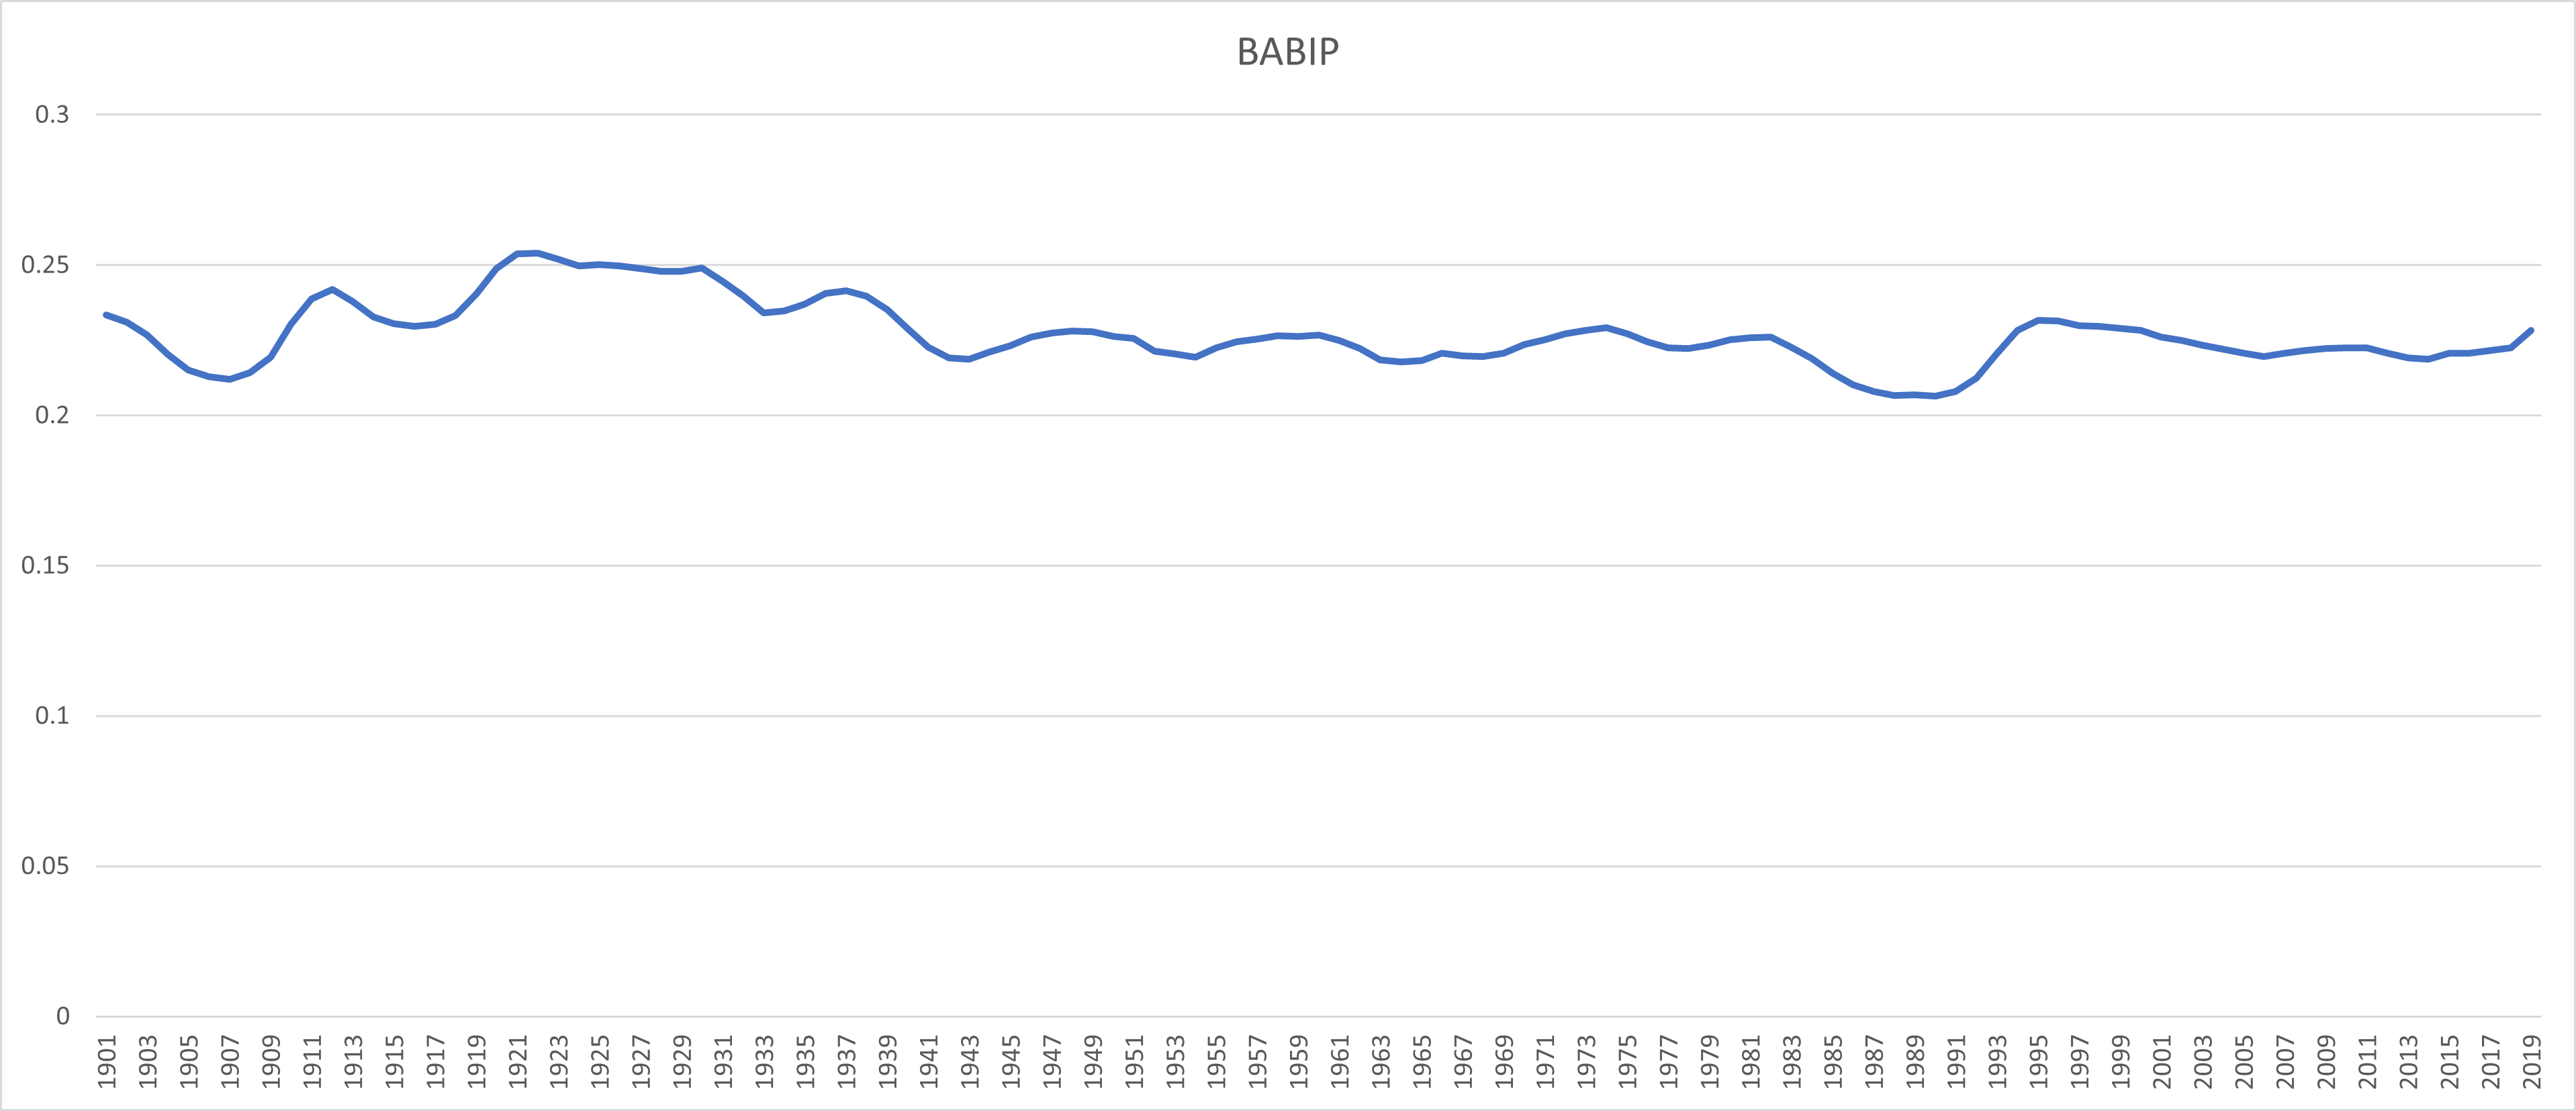
This is mostly flat over time. You have a low point in the early deadball era, and again in the late 80s/early 90s just before the "steroid era" offensive explosion. The rate was relatively high in the live ball era of the 1920s/30s. Today (or in recent years up to and including 2019) pitcher hitting was worse than ever, but that is all because of the strikeouts. When they made contact with the ball, they were able to get hits or homers at rates that are normal over baseball history.
This kind of implies that there is only one path to pitcher improvement. Keep the batter from making contact with the ball. Because when they do make contact, the result is mostly out of your control.
Extra base hits
I did not make any timeline adjustments for extra base hits (non-homer variety) as a percent of all hits in play. This ratio has generally increased over time, from about 20% in the deadball era to around 25% today. I am making the assumption that this is a real improvement for hitters, so a hitter from 2019 with a 25% rate will keep that rate in an earlier era.
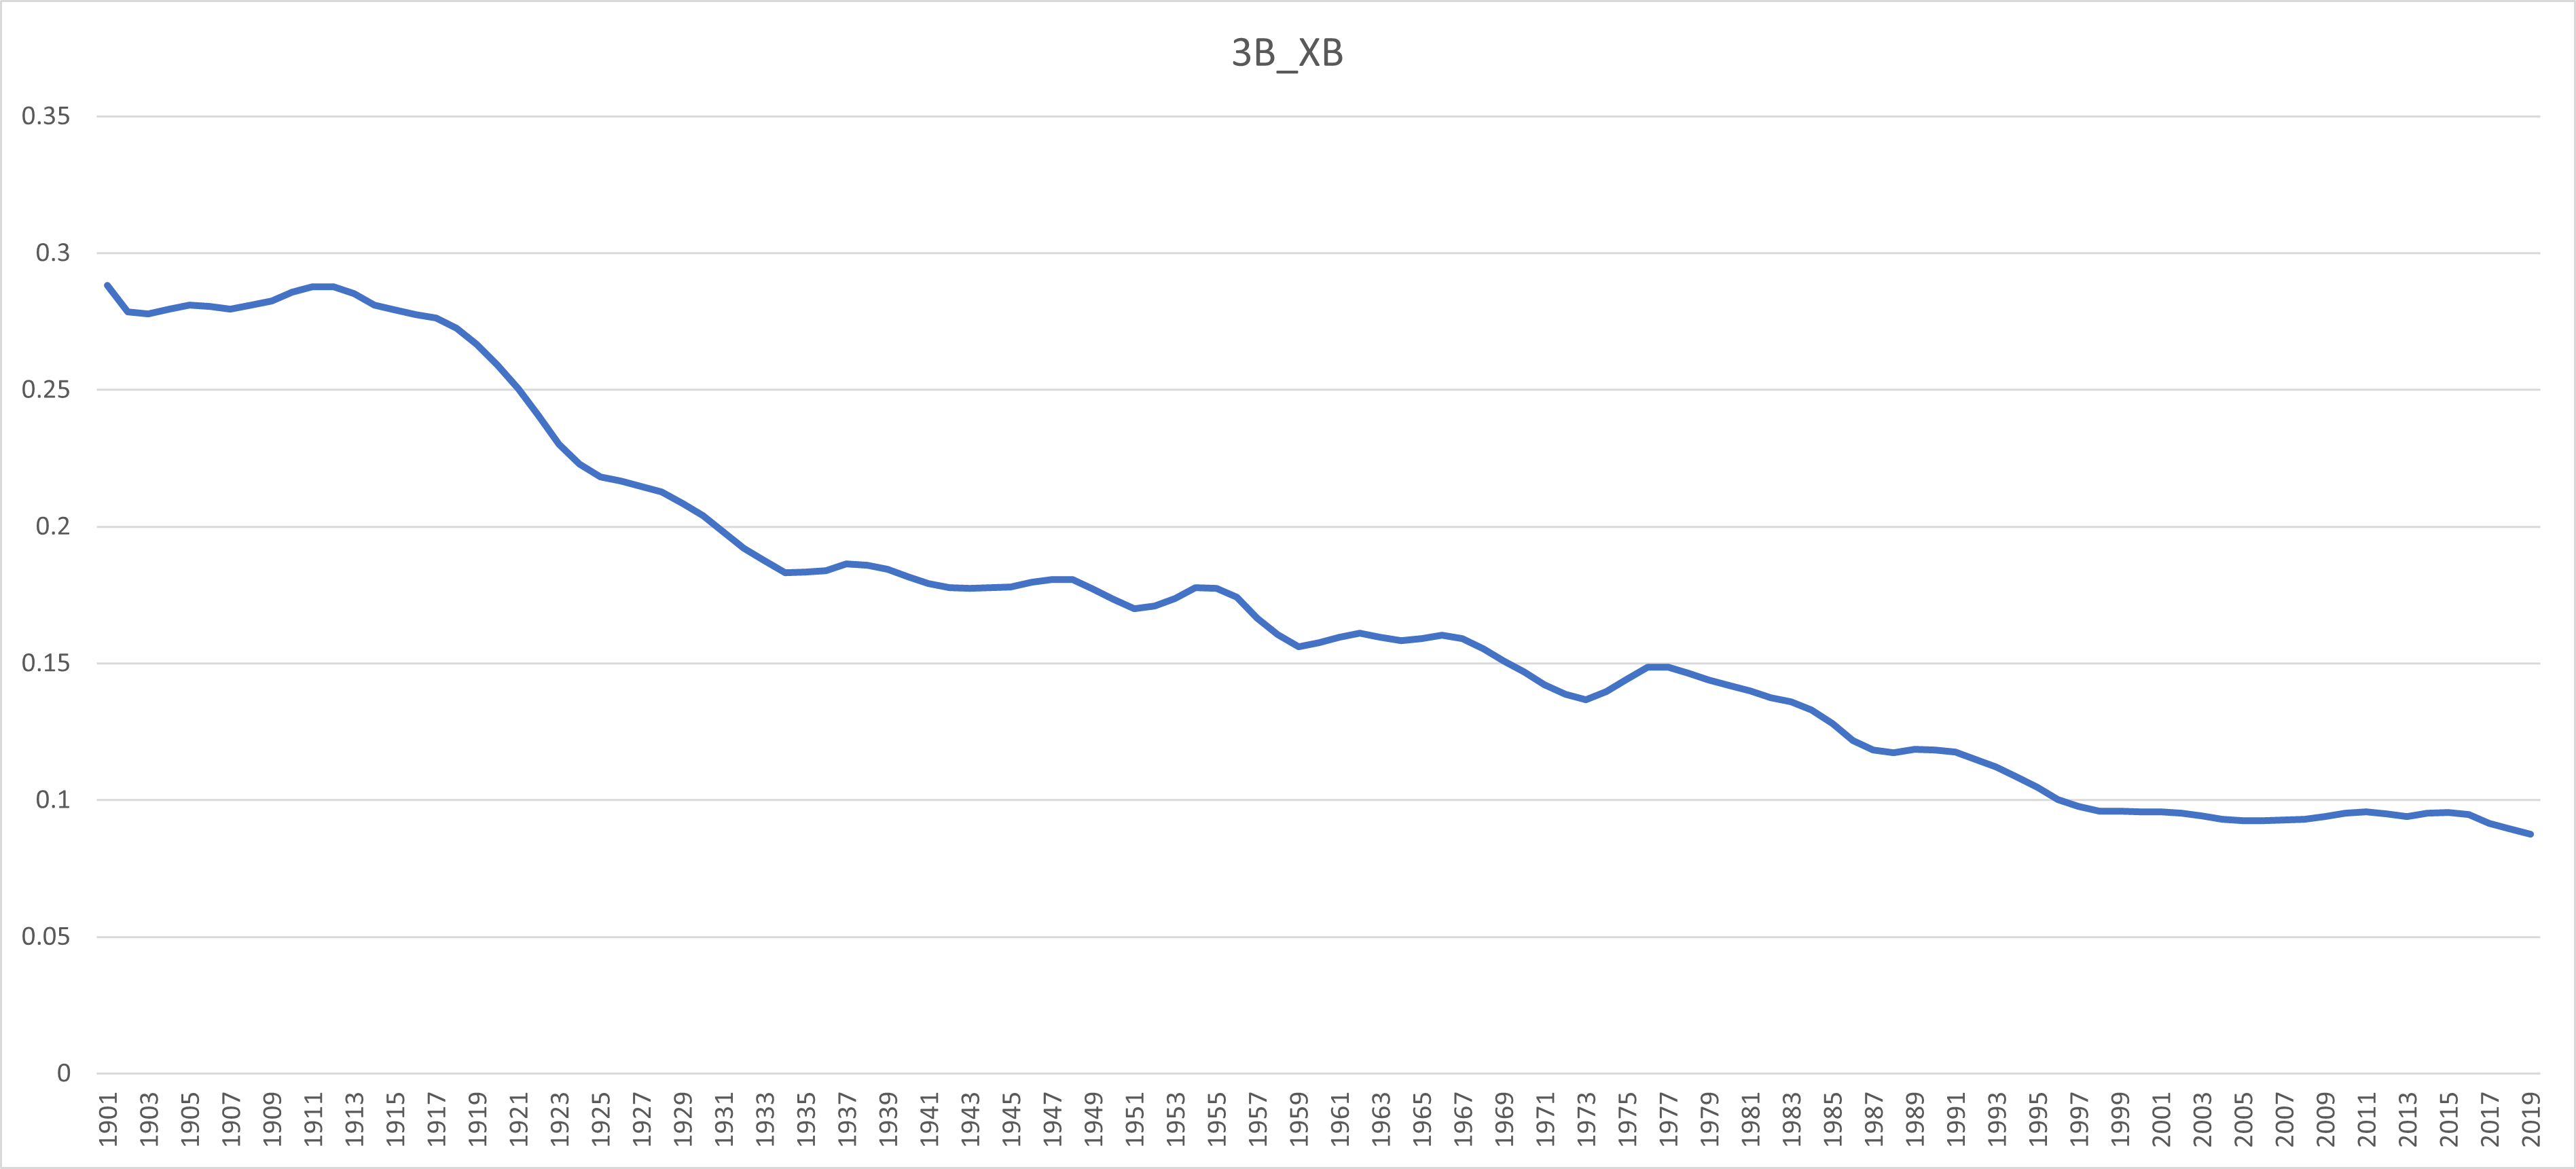
Triples
This is triples as a percentage of extra base hits (not including homers). This has generally decreased over time, from nearly 30% in the deadball era to a little under 10% today. I am not looking at pitcher-hitting for this one because pitchers hitting a triple is too rare of an even. I am making the assumption that the higher triple numbers are mostly due to the ballpark dimensions. A high triple hitter in 1910 would hit many fewer (stopping at 2B for a double) today, while a player of today would see more of their doubles turn into triples.
Factors used
Feel free to use these to set up your own timelining database if you wish. You are free to write about it wherever you like if interested, a link to this page would be appreciated. Just note: I am not technical support, and if you don't know how to set up a database, I can't help you.
| yearid |
kpct |
babip |
bbpct |
hrcon |
3bxb |
woba_lg |
obp_lg |
slg_lg |
| 1901 |
0.1667 |
0.2334 |
0.048 |
0.007 |
0.2881 |
0.307 |
0.327 |
0.36 |
| 1902 |
0.1712 |
0.231 |
0.0473 |
0.0039 |
0.2785 |
0.299 |
0.322 |
0.344 |
| 1903 |
0.1785 |
0.2267 |
0.0468 |
0.0035 |
0.2778 |
0.298 |
0.317 |
0.346 |
| 1904 |
0.1817 |
0.2203 |
0.047 |
0.0048 |
0.2794 |
0.28 |
0.301 |
0.321 |
| 1905 |
0.1867 |
0.2152 |
0.0485 |
0.004 |
0.2811 |
0.285 |
0.307 |
0.323 |
| 1906 |
0.1912 |
0.2129 |
0.0499 |
0.0039 |
0.2804 |
0.281 |
0.306 |
0.314 |
| 1907 |
0.2019 |
0.2121 |
0.0503 |
0.0046 |
0.2795 |
0.278 |
0.305 |
0.309 |
| 1908 |
0.2133 |
0.2142 |
0.0501 |
0.0027 |
0.2809 |
0.273 |
0.297 |
0.305 |
| 1909 |
0.223 |
0.2193 |
0.0506 |
0.0032 |
0.2824 |
0.28 |
0.306 |
0.311 |
| 1910 |
0.2318 |
0.2302 |
0.0523 |
0.005 |
0.2858 |
0.292 |
0.318 |
0.326 |
| 1911 |
0.2396 |
0.2389 |
0.0534 |
0.0047 |
0.2878 |
0.312 |
0.336 |
0.357 |
| 1912 |
0.2477 |
0.242 |
0.0538 |
0.0047 |
0.2876 |
0.313 |
0.337 |
0.359 |
| 1913 |
0.2526 |
0.2378 |
0.0529 |
0.0047 |
0.2852 |
0.302 |
0.325 |
0.345 |
| 1914 |
0.257 |
0.2327 |
0.0516 |
0.0048 |
0.281 |
0.297 |
0.321 |
0.337 |
| 1915 |
0.2606 |
0.2305 |
0.0501 |
0.0053 |
0.2793 |
0.294 |
0.318 |
0.332 |
| 1916 |
0.2596 |
0.2297 |
0.0485 |
0.0041 |
0.2776 |
0.289 |
0.312 |
0.326 |
| 1917 |
0.2502 |
0.2303 |
0.0481 |
0.0043 |
0.2764 |
0.287 |
0.311 |
0.324 |
| 1918 |
0.2359 |
0.2332 |
0.0487 |
0.0047 |
0.2726 |
0.291 |
0.317 |
0.325 |
| 1919 |
0.2246 |
0.2403 |
0.049 |
0.0055 |
0.2666 |
0.301 |
0.322 |
0.348 |
| 1920 |
0.2178 |
0.2488 |
0.0484 |
0.0065 |
0.2592 |
0.316 |
0.335 |
0.372 |
| 1921 |
0.2131 |
0.2538 |
0.0463 |
0.0074 |
0.2505 |
0.333 |
0.348 |
0.403 |
| 1922 |
0.2076 |
0.254 |
0.0456 |
0.0078 |
0.2406 |
0.333 |
0.348 |
0.401 |
| 1923 |
0.2009 |
0.2519 |
0.0458 |
0.0082 |
0.2302 |
0.329 |
0.347 |
0.391 |
| 1924 |
0.1967 |
0.2498 |
0.0471 |
0.0082 |
0.2228 |
0.331 |
0.348 |
0.394 |
| 1925 |
0.1968 |
0.2501 |
0.047 |
0.0084 |
0.2182 |
0.34 |
0.354 |
0.411 |
| 1926 |
0.2015 |
0.2497 |
0.0462 |
0.008 |
0.2167 |
0.327 |
0.345 |
0.389 |
| 1927 |
0.2052 |
0.2488 |
0.0453 |
0.008 |
0.2146 |
0.329 |
0.345 |
0.393 |
| 1928 |
0.2074 |
0.248 |
0.0459 |
0.0082 |
0.2127 |
0.33 |
0.344 |
0.397 |
| 1929 |
0.2074 |
0.2479 |
0.0473 |
0.0086 |
0.2086 |
0.341 |
0.353 |
0.417 |
| 1930 |
0.2104 |
0.249 |
0.0489 |
0.0086 |
0.2039 |
0.349 |
0.356 |
0.434 |
| 1931 |
0.2103 |
0.2446 |
0.0489 |
0.008 |
0.1981 |
0.325 |
0.339 |
0.391 |
| 1932 |
0.2122 |
0.2397 |
0.0477 |
0.008 |
0.1921 |
0.327 |
0.337 |
0.4 |
| 1933 |
0.2121 |
0.2341 |
0.0466 |
0.0077 |
0.1877 |
0.315 |
0.33 |
0.376 |
| 1934 |
0.2158 |
0.2347 |
0.0463 |
0.0081 |
0.1831 |
0.329 |
0.342 |
0.397 |
| 1935 |
0.2195 |
0.237 |
0.0471 |
0.008 |
0.1834 |
0.328 |
0.341 |
0.397 |
| 1936 |
0.223 |
0.2406 |
0.0474 |
0.008 |
0.1839 |
0.335 |
0.349 |
0.404 |
| 1937 |
0.2254 |
0.2415 |
0.0477 |
0.0086 |
0.1864 |
0.33 |
0.343 |
0.399 |
| 1938 |
0.2274 |
0.2397 |
0.0472 |
0.0089 |
0.1858 |
0.33 |
0.343 |
0.396 |
| 1939 |
0.2309 |
0.2352 |
0.0475 |
0.0088 |
0.1844 |
0.33 |
0.344 |
0.397 |
| 1940 |
0.2356 |
0.2289 |
0.0471 |
0.0095 |
0.1817 |
0.323 |
0.334 |
0.392 |
| 1941 |
0.2355 |
0.2227 |
0.0471 |
0.008 |
0.1792 |
0.318 |
0.334 |
0.375 |
| 1942 |
0.231 |
0.2191 |
0.0469 |
0.0066 |
0.1778 |
0.304 |
0.323 |
0.35 |
| 1943 |
0.2214 |
0.2188 |
0.0479 |
0.0055 |
0.1774 |
0.301 |
0.323 |
0.344 |
| 1944 |
0.2201 |
0.2211 |
0.048 |
0.0062 |
0.1776 |
0.307 |
0.326 |
0.358 |
| 1945 |
0.2256 |
0.2232 |
0.0474 |
0.0061 |
0.1779 |
0.308 |
0.329 |
0.355 |
| 1946 |
0.2379 |
0.226 |
0.0472 |
0.0076 |
0.1796 |
0.31 |
0.328 |
0.36 |
| 1947 |
0.2423 |
0.2273 |
0.0492 |
0.0097 |
0.1807 |
0.32 |
0.336 |
0.377 |
| 1948 |
0.2405 |
0.228 |
0.054 |
0.0096 |
0.1806 |
0.324 |
0.341 |
0.382 |
| 1949 |
0.2352 |
0.2278 |
0.0578 |
0.0105 |
0.1772 |
0.327 |
0.344 |
0.384 |
| 1950 |
0.2354 |
0.2264 |
0.058 |
0.0093 |
0.1734 |
0.334 |
0.346 |
0.402 |
| 1951 |
0.2391 |
0.2257 |
0.0547 |
0.0083 |
0.1701 |
0.323 |
0.336 |
0.386 |
| 1952 |
0.2468 |
0.2214 |
0.0517 |
0.0078 |
0.1709 |
0.313 |
0.327 |
0.37 |
| 1953 |
0.2537 |
0.2205 |
0.0514 |
0.0093 |
0.1738 |
0.327 |
0.336 |
0.397 |
| 1954 |
0.2635 |
0.2194 |
0.0536 |
0.0088 |
0.1778 |
0.324 |
0.333 |
0.39 |
| 1955 |
0.2728 |
0.2224 |
0.0547 |
0.0103 |
0.1775 |
0.325 |
0.332 |
0.394 |
| 1956 |
0.2861 |
0.2245 |
0.0547 |
0.0109 |
0.1742 |
0.326 |
0.331 |
0.397 |
| 1957 |
0.3009 |
0.2255 |
0.0527 |
0.0112 |
0.1665 |
0.32 |
0.324 |
0.391 |
| 1958 |
0.3163 |
0.2266 |
0.0522 |
0.0105 |
0.1606 |
0.321 |
0.325 |
0.394 |
| 1959 |
0.3275 |
0.2264 |
0.0518 |
0.0103 |
0.1561 |
0.32 |
0.324 |
0.392 |
| 1960 |
0.3343 |
0.2267 |
0.0528 |
0.01 |
0.1575 |
0.319 |
0.324 |
0.388 |
| 1961 |
0.3414 |
0.2249 |
0.0514 |
0.0104 |
0.1596 |
0.325 |
0.328 |
0.399 |
| 1962 |
0.3527 |
0.2222 |
0.0498 |
0.0102 |
0.161 |
0.322 |
0.326 |
0.393 |
| 1963 |
0.3672 |
0.2184 |
0.0471 |
0.01 |
0.1595 |
0.305 |
0.309 |
0.372 |
| 1964 |
0.379 |
0.2177 |
0.0454 |
0.0097 |
0.1582 |
0.309 |
0.313 |
0.378 |
| 1965 |
0.3853 |
0.2183 |
0.0429 |
0.0095 |
0.1591 |
0.306 |
0.311 |
0.372 |
| 1966 |
0.3869 |
0.2206 |
0.0403 |
0.0093 |
0.1603 |
0.307 |
0.31 |
0.376 |
| 1967 |
0.389 |
0.2197 |
0.0394 |
0.0092 |
0.1591 |
0.298 |
0.306 |
0.357 |
| 1968 |
0.3898 |
0.2195 |
0.0407 |
0.0099 |
0.1553 |
0.288 |
0.299 |
0.34 |
| 1969 |
0.3874 |
0.2207 |
0.0438 |
0.0107 |
0.1508 |
0.31 |
0.32 |
0.369 |
| 1970 |
0.3806 |
0.2235 |
0.0453 |
0.0108 |
0.1469 |
0.319 |
0.326 |
0.385 |
| 1971 |
0.3713 |
0.2252 |
0.0455 |
0.01 |
0.1422 |
0.307 |
0.317 |
0.365 |
| 1972 |
0.3615 |
0.2272 |
0.0453 |
0.0087 |
0.1388 |
0.3 |
0.311 |
0.354 |
| 1973 |
0.3503 |
0.2283 |
0.0471 |
0.0088 |
0.1368 |
0.316 |
0.325 |
0.379 |
| 1974 |
0.3399 |
0.2293 |
0.049 |
0.0073 |
0.1396 |
0.312 |
0.324 |
0.369 |
| 1975 |
0.3331 |
0.2271 |
0.0496 |
0.0067 |
0.1441 |
0.316 |
0.327 |
0.374 |
| 1976 |
0.3294 |
0.2245 |
0.047 |
0.0069 |
0.1485 |
0.307 |
0.32 |
0.361 |
| 1977 |
0.329 |
0.2226 |
0.0431 |
0.0079 |
0.1487 |
0.326 |
0.329 |
0.401 |
| 1978 |
0.3295 |
0.2222 |
0.0399 |
0.0072 |
0.1464 |
0.315 |
0.323 |
0.379 |
| 1979 |
0.332 |
0.2233 |
0.0393 |
0.0075 |
0.144 |
0.325 |
0.33 |
0.397 |
| 1980 |
0.3373 |
0.2252 |
0.0403 |
0.007 |
0.1419 |
0.32 |
0.326 |
0.388 |
| 1981 |
0.3434 |
0.2259 |
0.0412 |
0.0066 |
0.1399 |
0.31 |
0.32 |
0.369 |
| 1982 |
0.35 |
0.226 |
0.0403 |
0.0075 |
0.1375 |
0.319 |
0.324 |
0.389 |
| 1983 |
0.3521 |
0.2227 |
0.0396 |
0.0075 |
0.136 |
0.319 |
0.325 |
0.389 |
| 1984 |
0.3544 |
0.219 |
0.0389 |
0.0077 |
0.1329 |
0.317 |
0.323 |
0.385 |
| 1985 |
0.3558 |
0.2139 |
0.0389 |
0.0082 |
0.128 |
0.319 |
0.323 |
0.391 |
| 1986 |
0.3582 |
0.2103 |
0.0371 |
0.0085 |
0.1217 |
0.322 |
0.326 |
0.395 |
| 1987 |
0.3569 |
0.208 |
0.0362 |
0.01 |
0.1184 |
0.332 |
0.331 |
0.415 |
| 1988 |
0.3539 |
0.2067 |
0.0358 |
0.0073 |
0.1174 |
0.312 |
0.318 |
0.378 |
| 1989 |
0.3495 |
0.2068 |
0.0382 |
0.007 |
0.1185 |
0.312 |
0.32 |
0.375 |
| 1990 |
0.3462 |
0.2065 |
0.0387 |
0.007 |
0.1184 |
0.318 |
0.325 |
0.385 |
| 1991 |
0.3417 |
0.208 |
0.0388 |
0.0069 |
0.1176 |
0.317 |
0.323 |
0.385 |
| 1992 |
0.3396 |
0.2124 |
0.0361 |
0.0064 |
0.1149 |
0.314 |
0.322 |
0.377 |
| 1993 |
0.3433 |
0.2205 |
0.0356 |
0.0079 |
0.1122 |
0.329 |
0.332 |
0.403 |
| 1994 |
0.3548 |
0.2282 |
0.0361 |
0.0091 |
0.1083 |
0.339 |
0.339 |
0.424 |
| 1995 |
0.3709 |
0.2317 |
0.0386 |
0.009 |
0.1046 |
0.336 |
0.338 |
0.417 |
| 1996 |
0.3819 |
0.2315 |
0.0404 |
0.0097 |
0.1003 |
0.341 |
0.34 |
0.427 |
| 1997 |
0.387 |
0.2299 |
0.042 |
0.0091 |
0.0978 |
0.337 |
0.337 |
0.419 |
| 1998 |
0.3832 |
0.2297 |
0.0428 |
0.0092 |
0.096 |
0.336 |
0.335 |
0.42 |
| 1999 |
0.379 |
0.2289 |
0.0419 |
0.0101 |
0.0959 |
0.346 |
0.345 |
0.434 |
| 2000 |
0.3747 |
0.2283 |
0.0395 |
0.0104 |
0.0958 |
0.347 |
0.345 |
0.437 |
| 2001 |
0.3724 |
0.2261 |
0.0366 |
0.0099 |
0.0958 |
0.337 |
0.332 |
0.427 |
| 2002 |
0.372 |
0.2249 |
0.0354 |
0.0092 |
0.0952 |
0.333 |
0.331 |
0.417 |
| 2003 |
0.3701 |
0.2234 |
0.0352 |
0.0095 |
0.0942 |
0.335 |
0.333 |
0.422 |
| 2004 |
0.3722 |
0.222 |
0.0357 |
0.0099 |
0.0931 |
0.339 |
0.335 |
0.428 |
| 2005 |
0.3726 |
0.2206 |
0.0355 |
0.0091 |
0.0926 |
0.333 |
0.33 |
0.419 |
| 2006 |
0.3791 |
0.2195 |
0.0364 |
0.0098 |
0.0924 |
0.341 |
0.337 |
0.432 |
| 2007 |
0.3829 |
0.2206 |
0.0379 |
0.009 |
0.0927 |
0.337 |
0.336 |
0.423 |
| 2008 |
0.3888 |
0.2215 |
0.0399 |
0.0089 |
0.0929 |
0.334 |
0.333 |
0.416 |
| 2009 |
0.3895 |
0.2223 |
0.0402 |
0.0092 |
0.0941 |
0.334 |
0.333 |
0.418 |
| 2010 |
0.3945 |
0.2226 |
0.0389 |
0.0084 |
0.0953 |
0.325 |
0.325 |
0.403 |
| 2011 |
0.4016 |
0.2224 |
0.0371 |
0.0083 |
0.0956 |
0.321 |
0.321 |
0.399 |
| 2012 |
0.4143 |
0.2208 |
0.0354 |
0.009 |
0.095 |
0.322 |
0.319 |
0.405 |
| 2013 |
0.4223 |
0.2191 |
0.0339 |
0.0085 |
0.0941 |
0.318 |
0.318 |
0.396 |
| 2014 |
0.4286 |
0.2188 |
0.0327 |
0.0076 |
0.0951 |
0.313 |
0.314 |
0.386 |
| 2015 |
0.4321 |
0.2207 |
0.0321 |
0.0089 |
0.0955 |
0.321 |
0.317 |
0.405 |
| 2016 |
0.4407 |
0.2208 |
0.0325 |
0.0102 |
0.0947 |
0.328 |
0.322 |
0.417 |
| 2017 |
0.4529 |
0.2216 |
0.0327 |
0.0104 |
0.0915 |
0.333 |
0.324 |
0.426 |
| 2018 |
0.4665 |
0.2226 |
0.0327 |
0.0102 |
0.0895 |
0.324 |
0.318 |
0.409 |
| 2019 |
0.4783 |
0.2282 |
0.0327 |
0.0106 |
0.0875 |
0.335 |
0.323 |
0.435 |
This page was last modified 2/07/2021
|
